KPIsAll key numbers in view
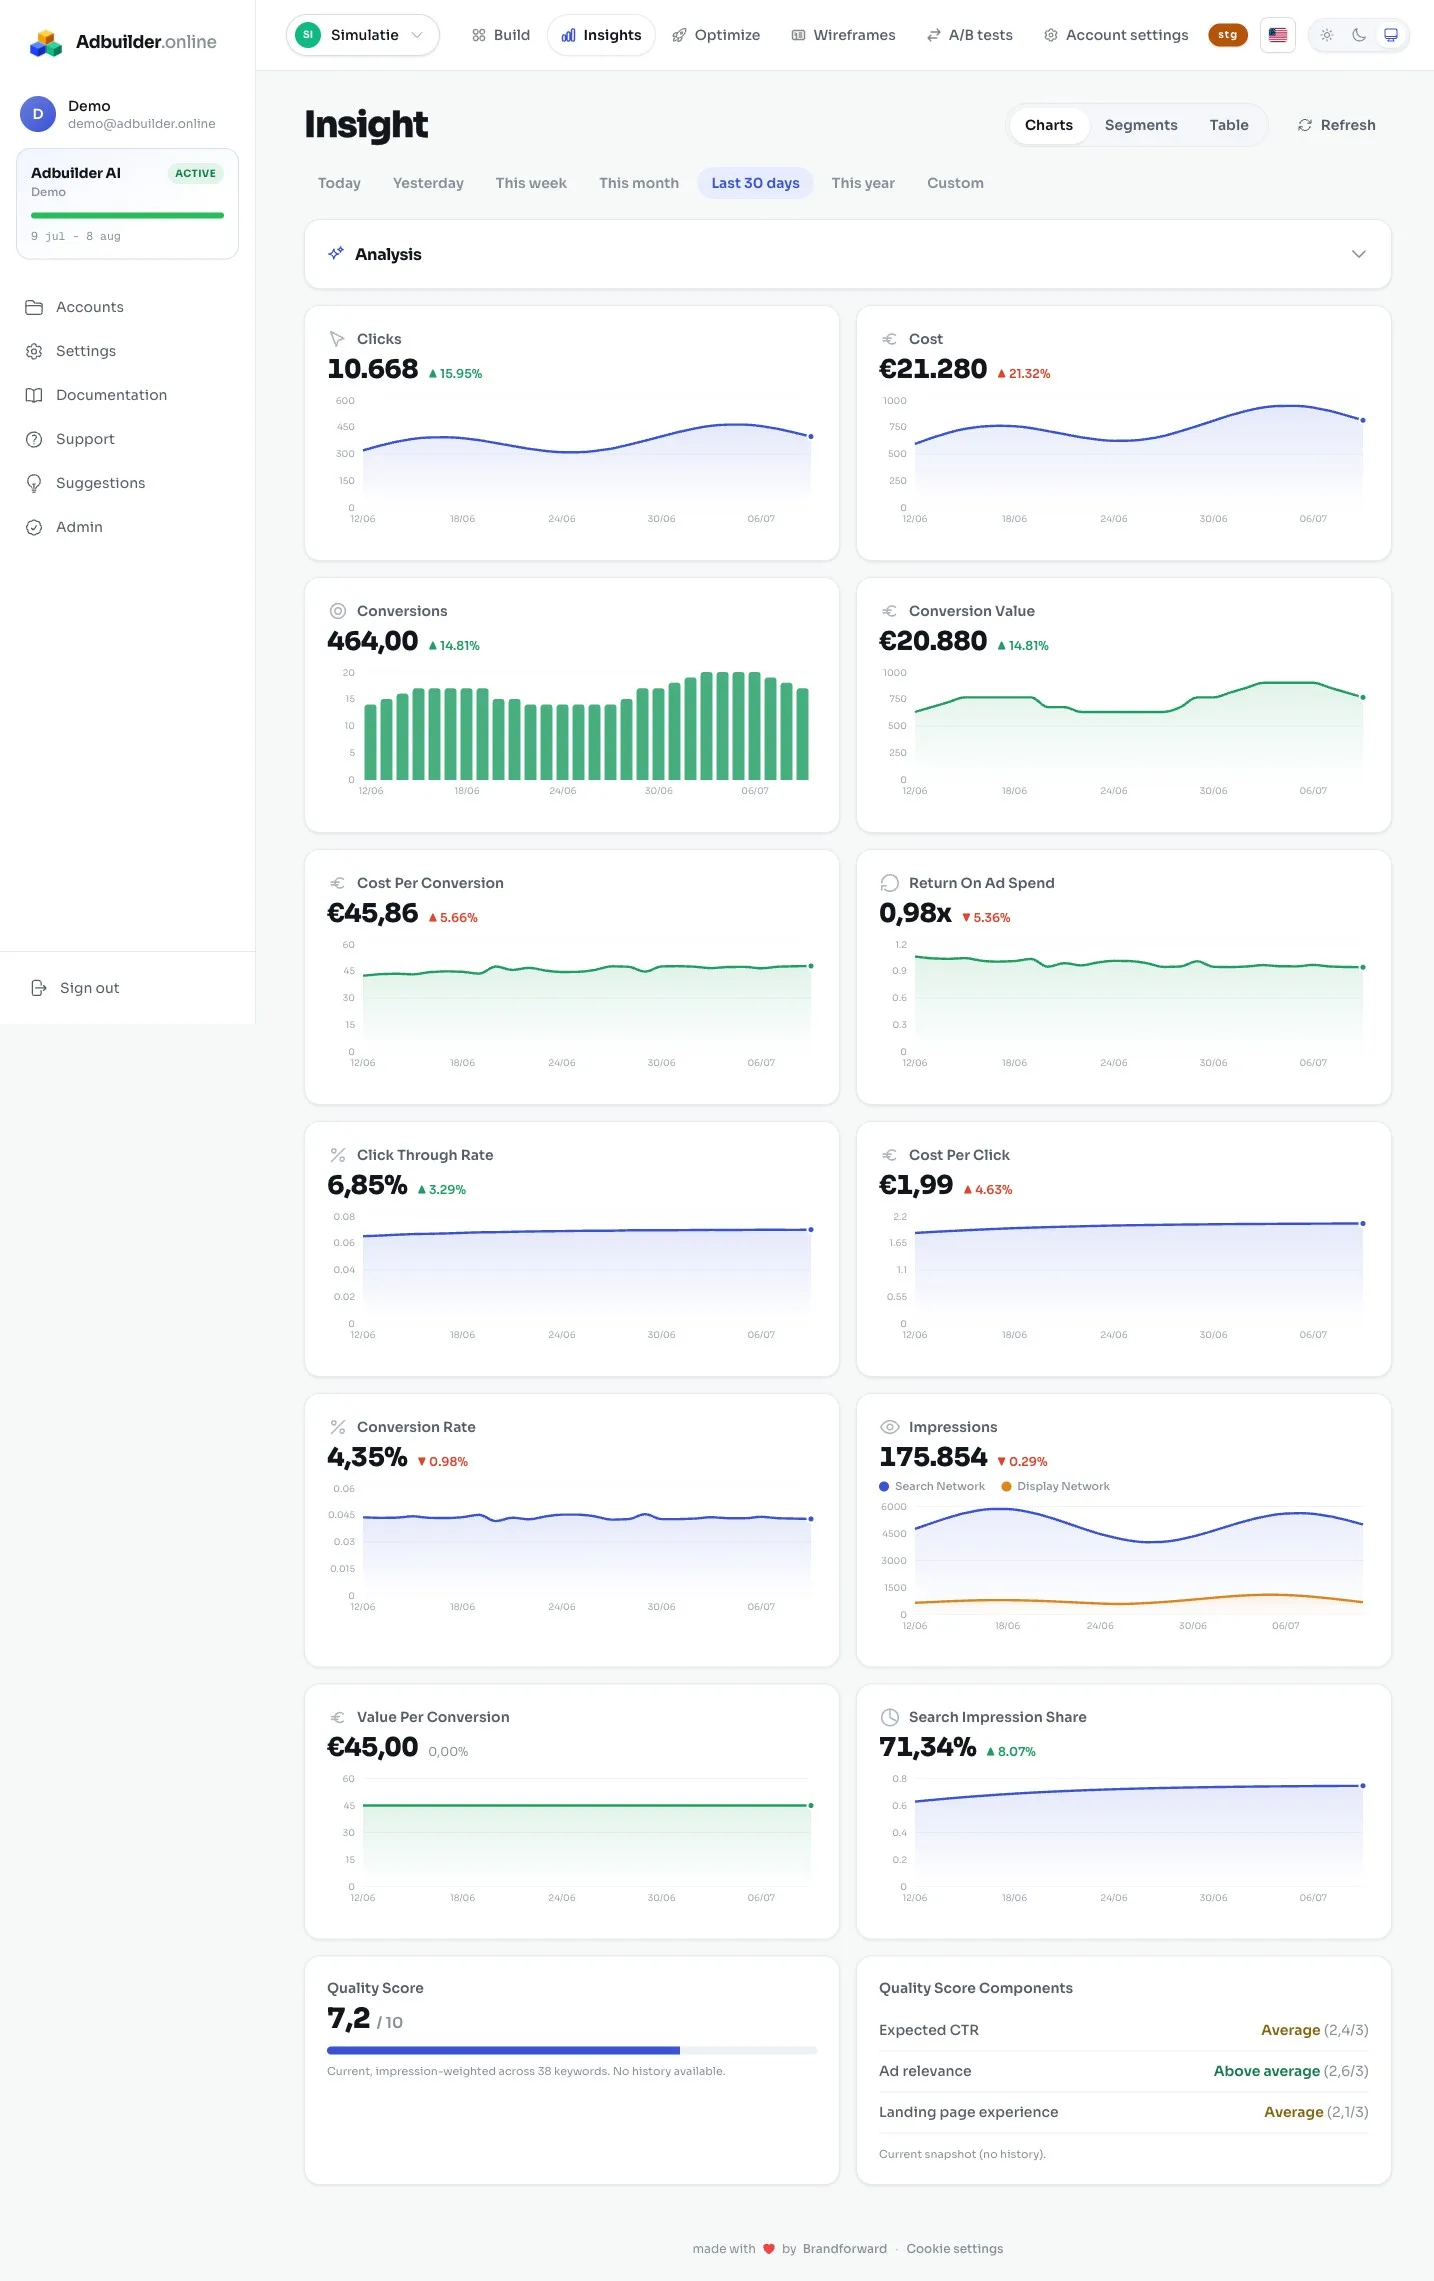
The dashboard runs on your real Google Ads daily numbers. Each KPI appears as a card with a large number, a change and a mini chart. The change compares the first half of the chosen period with the second half. That way you immediately see whether a number is rising or falling within the period you are viewing.
- Clicks, cost, impressions, CTR and CPC.
- Conversions, conversion value, CPA, ROAS and conversion rate.
- Value per conversion and impression share (Search Impression Share).
- Impressions split by Search and Display network.
- Quality Score and its components (expected CTR, ad relevance and landing page experience).
InterpretingWhat the numbers tell you
The numbers themselves do not say all that much. It is about what you derive from them. Below, for each commonly used KPI, is what a notable value means and what you then look at:
- ROAS below 1: you bring in less revenue than you spend on ads. Look at your search terms, your bids and your landing pages.
- Low CTR: your ad does not match the search query well. Tighten your ad copy or your keywords.
- Low impression share: you are missing impressions due to too little budget or too low a rank. Raise your budget or your bid, or improve your Quality Score.
- High CPA: a conversion costs you a lot. Prune expensive, non-converting search terms and check your bid strategy.
- Low Quality Score: see which component lags (expected CTR, ad relevance or landing page experience) and address it specifically.
PeriodChoose your date range
You choose a period via presets (today, yesterday, this week, this month, last 30 days, this year) or a custom range. For today or yesterday you see the numbers per hour. For a single day you see a 30-day trend line with that day marked. Remember that the change per KPI sets the first half of your period against the second half. If you choose a short period, that change reacts more quickly to chance.